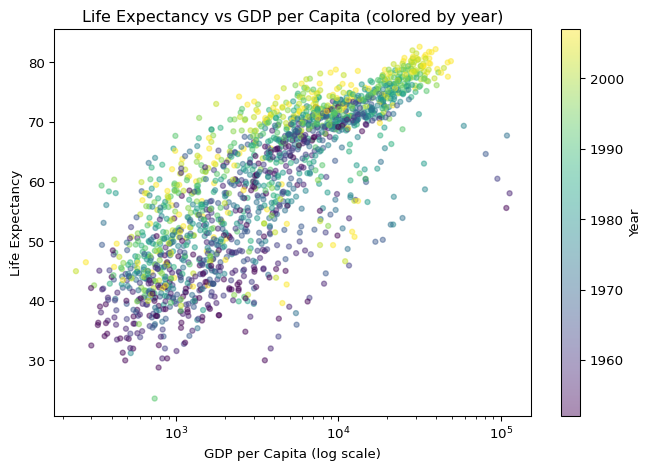
This page examines how life expectancy relates to GDP per capita across countries and over time (colored by year).
import pandas as pdimport numpy as npimport matplotlib.pyplot as pltdf = pd.read_csv("gapminder.csv").dropna(subset=["gdp_per_capita", "life_expectancy", "year"])df = df[df["gdp_per_capita"] >0].copy()x = df["gdp_per_capita"].astype(float).to_numpy()y = df["life_expectancy"].astype(float).to_numpy()t = df["year"].astype(int).to_numpy()plt.figure()sc = plt.scatter(x, y, c=t, s=14, alpha=0.45)plt.xscale("log")plt.xlabel("GDP per Capita (log scale)")plt.ylabel("Life Expectancy")plt.title("Life Expectancy vs GDP per Capita (colored by year)")plt.colorbar(sc, label="Year")plt.tight_layout()plt.show()